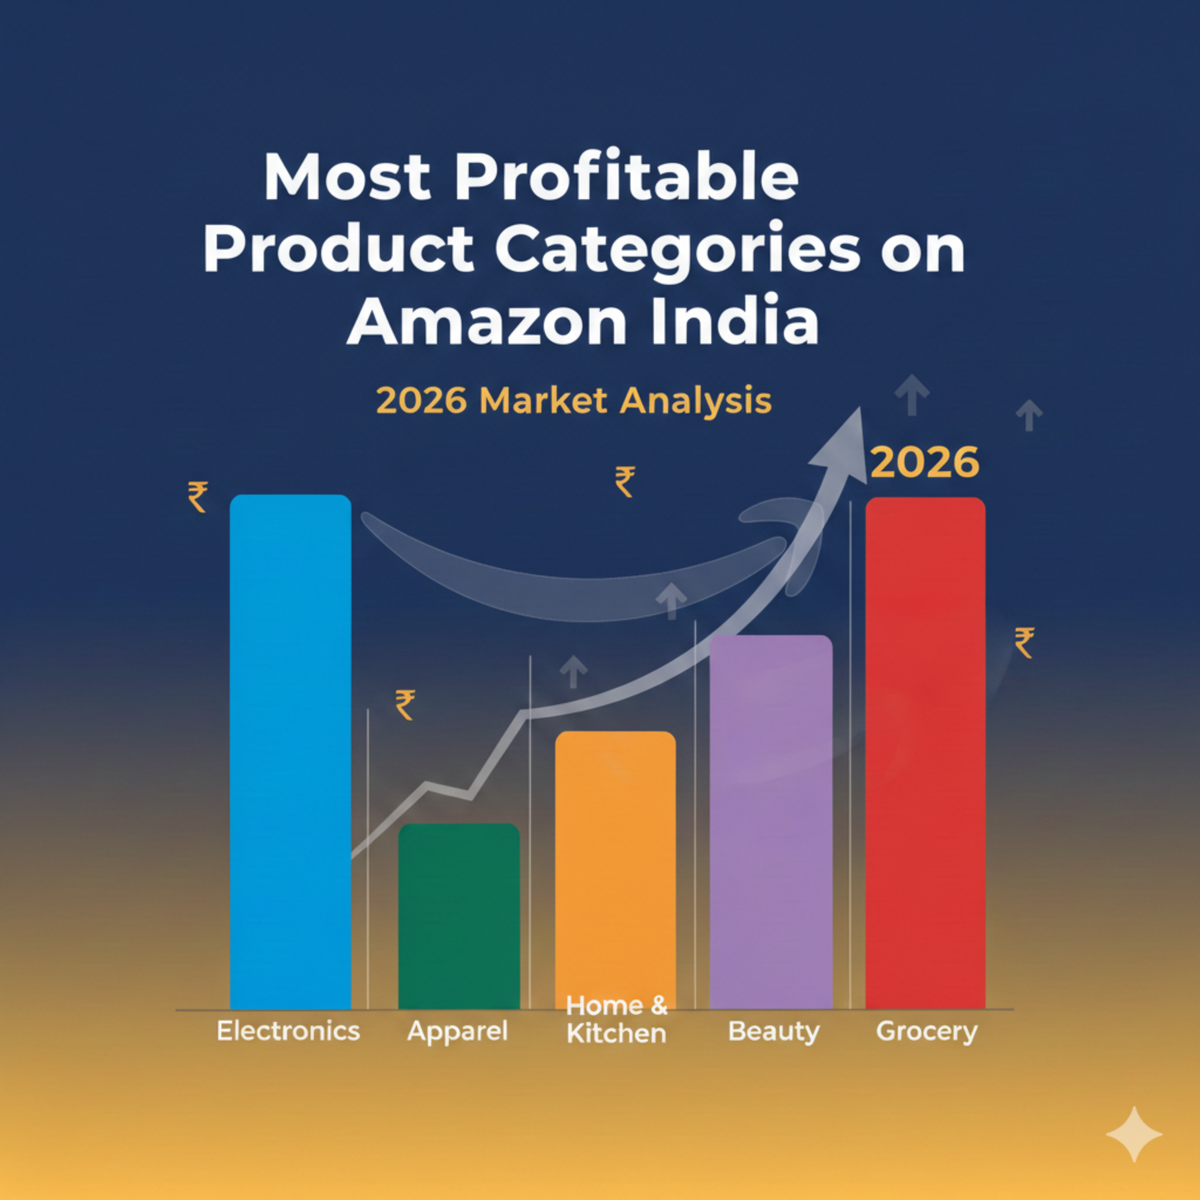
Most Profitable Product Categories on Amazon India: 2026 Market Analysis
India's e-commerce market is no longer in its experimentation phase, and by 2026 the question for Amazon India sellers has shifted from how fast the market is growing to which categories actually make money. Demand is everywhere; durable margin is not.
India's online retail market reached roughly US$163 billion in 2026 and is on a path toward US$345 billion by 2030, according to IBEF.
"India's e-commerce market is projected to reach US$345 billion by 2030." (India Brand Equity Foundation (IBEF), 2025.)
That expansion is supported by wider logistics, deeper smartphone use, and near-universal digital payments. More than 260 million Indians already shop online, a figure heading toward 300 million as mobile access spreads into tier-2 and tier-3 cities, with Amazon India holding close to 47% of online smartphone sales.
What has changed is margin pressure: platform fees, fulfilment costs, rising ad spend, and returns now matter as much as demand. A category that looked attractive on revenue alone can turn unprofitable once those costs are layered on, which is why the smart question is no longer "what sells?" but "what sells and keeps a margin?"
This analysis identifies where margins actually hold up on Amazon India, using market data, category-level profit ranges, and buyer behaviour, then sets out the traits that make a category worth entering.
Profitability versus sales volume
High demand does not automatically translate into high profit, a lesson most Amazon sellers learn the hard way. A net margin of 15–30% is generally considered healthy, with 20% or higher giving enough buffer to reinvest and absorb volatility.
"Categories such as electronics accessories, beauty and personal care, and pet supplies tend to outperform high-revenue but structurally thin categories like smartphones or large appliances." (SellerApp, Amazon seller profit-margin analysis.)
The working formula is simple but unforgiving: net margin equals total revenue minus total expenses, divided by revenue. Those expenses include product cost, Amazon referral fees (typically 5–20% by category), fulfilment, storage, advertising (often 10–20% of sales), and GST — so scale magnifies losses as efficiently as it magnifies profit, a pattern documented in SellerApp's profit-margin research.
The practical implication is that two sellers with identical revenue can have very different outcomes. The one selling a lightweight, low-return product in a 30–50% category keeps a real profit, while the one moving bulky, frequently-returned goods at 8–15% can run at a loss despite higher sales — which is why category selection is the first decision, not an afterthought.
The most profitable categories at a glance
Seven categories consistently preserve margin better than the high-revenue averages. The table below summarises typical margin ranges and why each holds up; detailed profiles follow.
Category | Typical margin | Why it holds up |
|---|---|---|
Electronics accessories | 30–50% (up to 60%) | High markup, light shipping, low returns |
Beauty & personal care | 20–40% (50%+ premium) | Repeat purchase, low fulfilment cost |
Pet supplies | 40–60% premium; 20–30% food | Loyalty, low returns, subscriptions |
Health & fitness | 30–50% | Lightweight, strong cross-sell |
Grocery & gourmet | 25–40% (specialty) | Premium niches, repeat orders |
Home & kitchen | 20–35% (small items) | Convenience and multi-function premium |
Fashion & apparel | 15–25%; 30–60% private label | Private-label control, staples repeat |
Beauty and personal care
India's beauty and personal care market is projected to reach about US$30 billion by 2027, growing around 10% a year, even though India is only about 5% of the global beauty industry. That combination of scale and headroom makes it one of the fastest-growing major markets, and a magnet for new D2C brands.
Margins vary widely within the category: standard cosmetics sit at 10–15%, skincare often reaches 20–40%, and premium or luxury beauty can exceed 50%. Skincare accounts for roughly 32% of top-performing beauty products, per Statista, followed by hair care and men's grooming.
The category works because it pairs low production costs with repeat purchasing, lightweight fulfilment, and rising demand for organic and dermatology-aligned products.
Repeat purchase is the structural advantage. A customer who likes a serum or shampoo reorders every few weeks, so the cost of winning that customer is spread across many orders — the opposite of one-off categories where each sale must carry its full acquisition cost.
Electronics accessories
Electronics is one of Amazon India's most active categories, driven by smartphone adoption approaching 80% of the population — roughly 1.18 billion users by 2026 on a nationwide 5G rollout. The profit, though, sits in accessories rather than devices.
Core electronics such as smartphones and laptops usually run on thin 8–15% margins. Accessories tell a different story: power banks, charging cables, and phone cases frequently achieve 40–60% margins, with most accessory ranges averaging 30–50%.
High markups, frequent replacement cycles, low return rates, and lightweight shipping make accessories structurally more profitable than the devices they support.
There is also a volume tailwind: every phone or laptop sold creates demand for several accessories over its life, from cases and chargers to earbuds and screen protectors. Selling into that attached demand, rather than competing on the device itself, is where independent sellers can hold margin against far larger rivals.
Fashion and apparel
Fashion is one of the largest online categories by revenue, at roughly 27% of India's e-commerce market, and the online fashion segment could grow from about US$16–17 billion in 2024 to US$40–45 billion by 2028. Size, however, does not guarantee margin.
Profitability depends on positioning: mass-market apparel typically delivers 15–25%, while private-label fashion accessories and customised jewellery can reach 30–60%. Private-label control, customisation premiums, and repeat purchases of staples like athleisure and ethnic wear support margin — provided returns are managed.
Returns are the category's defining risk. Apparel carries some of the highest return rates in e-commerce because of fit and colour mismatches, so accurate sizing guides, honest product images, and tight quality control are not optional extras but the difference between a profitable line and a loss-making one.
Home and kitchen
Home and kitchen continues to benefit from lifestyle shifts and quick commerce reshaping convenience expectations. Margin again depends on size of item.
Small kitchen appliances typically run at 20–30% and storage and organisation products at 25–35%, while large appliances fall closer to 10–15% due to logistics, installation, and higher returns. Products that save time, cut energy use, or combine functions consistently command a premium.
The size split is the key lesson here. The same category contains both winners and losers purely on form factor: a compact, courier-friendly appliance can be highly profitable, while a bulky one of similar retail price is dragged down by freight, damage, and installation costs that the seller often absorbs.
Pet supplies
Pet supplies have become one of e-commerce's strongest profit pools, with the global pet industry expected to reach US$500 billion by 2030 and India still riding sustained post-pandemic adoption. Margins are notably high in the premium segment.
Grooming tools, orthopedic beds, and premium accessories often deliver 40–60% margins, while consumables such as food and treats sit at 20–30%. Emotional attachment, brand loyalty, low return rates, and subscription potential make the category unusually resilient.
The consumable side is the quiet engine. Once an owner settles on a food or treat their pet tolerates, they rarely switch, so a modest-margin consumable becomes a recurring, predictable revenue stream that a higher-margin one-off purchase cannot match.
Grocery and gourmet foods
Amazon India's grocery segment is expanding rapidly, with strong double-digit year-on-year growth and sales that frequently double during festive periods. The margin lives in the premium niches, not staples, and shelf-stable specialty goods travel and store far better than perishables.
Specialty coffee, organic teas, gourmet spices, and health-focused snacks often achieve 25–40% margins on premium positioning and repeat purchases. Quick commerce now handles a large share of online grocery, raising the bar on delivery speed.
Everyday staples are the trap to avoid: they draw heavy competition and thin margins, often below 10%. The winning approach is to stay in differentiated, premium niches where brand story and quality justify a higher price, rather than competing on commoditised basics where the largest players set the floor.
Health and fitness
Health and fitness demand has stayed resilient beyond the pandemic, and Mordor Intelligence ranks wellness and personal care among the fastest-growing digital segments. The category is lightweight and cross-sells well, and a single customer often buys across sub-categories — a resistance band today, a supplement next month, a yoga mat after that — which lifts lifetime value well above the first order.
Fitness accessories commonly deliver 30–45% margins, supplements 35–50%, and yoga equipment 25–35%, helped by low shipping weight and consistent cross-sell into related products.
Supplements add a compliance dimension worth noting. Health claims, labelling, and quality standards are regulated, so sellers must source from compliant manufacturers and avoid unsubstantiated claims — the margins are attractive, but the category rewards trust and punishes shortcuts.
How to choose a profitable category
The categories above share 4 structural traits worth screening any product against: high markup, light shipping weight, low return rates, and repeat-purchase or subscription potential. A product that ticks all four can sustain a 20%+ margin even under heavy ad and fee pressure.
The discipline is to model every cost — referral fee, fulfilment, storage, ads, GST, and returns — before sourcing, not after. A category with a 40% gross margin can still lose money once a 15% return rate and 20% ad spend are layered in, so the real test is margin after all platform costs, not the headline markup.
A sensible starting point is to test a small range within one promising category rather than spreading thin across many. Concentrating on a focused catalogue makes it easier to negotiate supplier pricing, build review volume, and learn the true cost structure before scaling into adjacent products.
Reviews compound this advantage. A handful of strong products with high ratings convert far better and need less ad support than a scattered catalogue, so depth in one category usually beats breadth across several in the first year.
Methodology
This analysis draws on IBEF for market size, Statista for category share, Mordor Intelligence for D2C trends, and published Amazon-seller margin research (including SellerApp and seller-tool benchmarks). Quotations reflect the cited sources' published positions.
Category margin ranges are industry estimates from secondary sources and vary widely by sourcing, brand, and operational efficiency; they are indicative, not guarantees. Market-size figures use IBEF's broader e-commerce definition and may differ from narrower e-retail measures. This article is general information, not financial advice.
Frequently asked questions
Which Amazon India category is most profitable?
Electronics accessories and premium pet supplies tend to show the highest margins (often 40–60%), followed by premium beauty and supplements. Profitability depends on sourcing and cost control, not the category alone.
What is a healthy profit margin on Amazon India?
A net margin of 15–30% is considered healthy, with 20%+ giving enough buffer to absorb advertising, returns, and fee changes. Many sellers operate closer to 15–20% in competitive categories.
Why are smartphones and large appliances less profitable?
They are high-revenue but structurally thin, with margins around 8–15%, eroded by heavy shipping, installation, higher returns, and intense price competition. Accessories around those devices are far more profitable.
What costs eat into Amazon seller margins?
The main ones are Amazon referral fees (5–20% by category), fulfilment and storage, advertising (often 10–20% of sales), GST, and returns. Modelling all of them before sourcing is essential.
Do lightweight products really make more money?
Generally yes. Low shipping weight reduces fulfilment cost and return-shipping losses, which is why accessories, beauty, and supplements preserve margin better than bulky devices or large appliances.
Key takeaways
On Amazon India in 2026, profitability is decided by category choice more than sales volume, against a market heading from US$163 billion to US$345 billion by 2030.
A net margin of 15–30% is healthy; aim above 20% to absorb fees, ads, and returns.
The strongest margins sit in electronics accessories (30–60%), premium pet supplies (40–60%), beauty (20–50%+), and health and fitness (30–50%).
High-revenue categories like smartphones and large appliances are structurally thin at 8–15%.
Screen products for high markup, light weight, low returns, and repeat purchase — and model every cost before sourcing.